A faster site, measured on real visitors.

We find what makes your website slow for the people who use it, fix it in order of effect, and leave your analytics and consent banner working. It starts with an audit from €250.

Streams of light accelerating from left to right along thin horizontal lines

What it is

Speed is what your visitors get, not what a test shows.

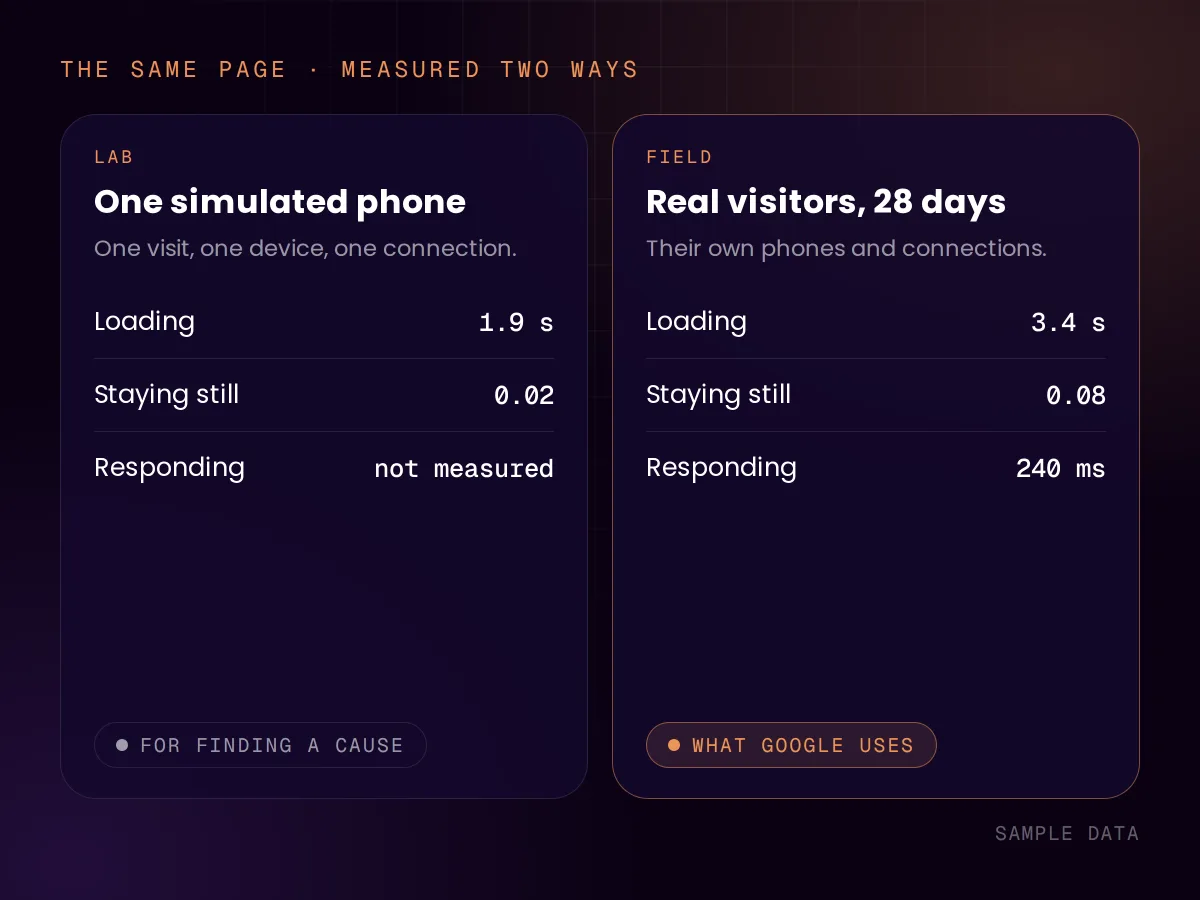
A website speed optimization service is usually sold on a score: a green number out of 100 from a test run on one simulated phone. Google does not judge your site on that number. It looks at what real visitors experienced over the past 28 days, on their own devices and connections.

So that is what we measure first. Then we fix the things that hold real visitors up, starting with the largest. We work on sites built with Nuxt and Next.js, which is what we build ourselves, and on WordPress and Shopify.

What Google measures

Three numbers, and where sites fail them.

Google calls them the Core Web Vitals. A page passes when, for each of the three, at least three out of four visits reach the good value, counted for phones and desktops separately.

Share of mobile websites rated good, Web Almanac 2025

  • LCPLoading

    Good: 2.5 seconds or less

    62% of mobile websites reach it

    Largest Contentful Paint: how long until the largest thing on the screen, often the main image or headline, is visible.

    Usual cause: a slow server response, or a main image that is too heavy or starts loading late.

  • INPResponding

    Good: 200 milliseconds or less

    77% of mobile websites reach it

    Interaction to Next Paint: how long the page takes to react when someone taps, clicks or types.

    Usual cause: too much JavaScript running at once, from the site itself or from added scripts.

  • CLSStaying still

    Good: 0.1 or less

    81% of mobile websites reach it

    Cumulative Layout Shift: how much the page jumps around while it loads.

    Usual cause: images, fonts or banners that take their space only after they arrive.

In 2025, 48% of mobile websites and 56% of desktop websites passed all three. Loading is where most fail, so that is usually where the work is.

Sources: Google, Web Vitals (opens in a new tab), Google, About PageSpeed Insights (opens in a new tab), HTTP Archive, Web Almanac 2025: Performance (opens in a new tab)

What we do

Measure, fix, keep.

Measure

Two kinds of data, kept apart.

Lab data is one test on one simulated device. It is useful for finding a cause. Field data comes from real Chrome users over the past 28 days, and it is what Google uses. The two often disagree: in Google’s words, the lab test does not represent “the variance that you see in the real world”.

We report both, labelled. We also run the lab test across the whole site, because the home page is rarely the slowest page. A small site may have no field data at all: Google leaves out pages and sites below a visitor threshold it does not disclose. Then the lab is all there is, and we say so.

  • Real-user data next to the lab score
  • Every page tested, not only the home page
  • Phones and desktops reported separately
Fix

The largest delay first.

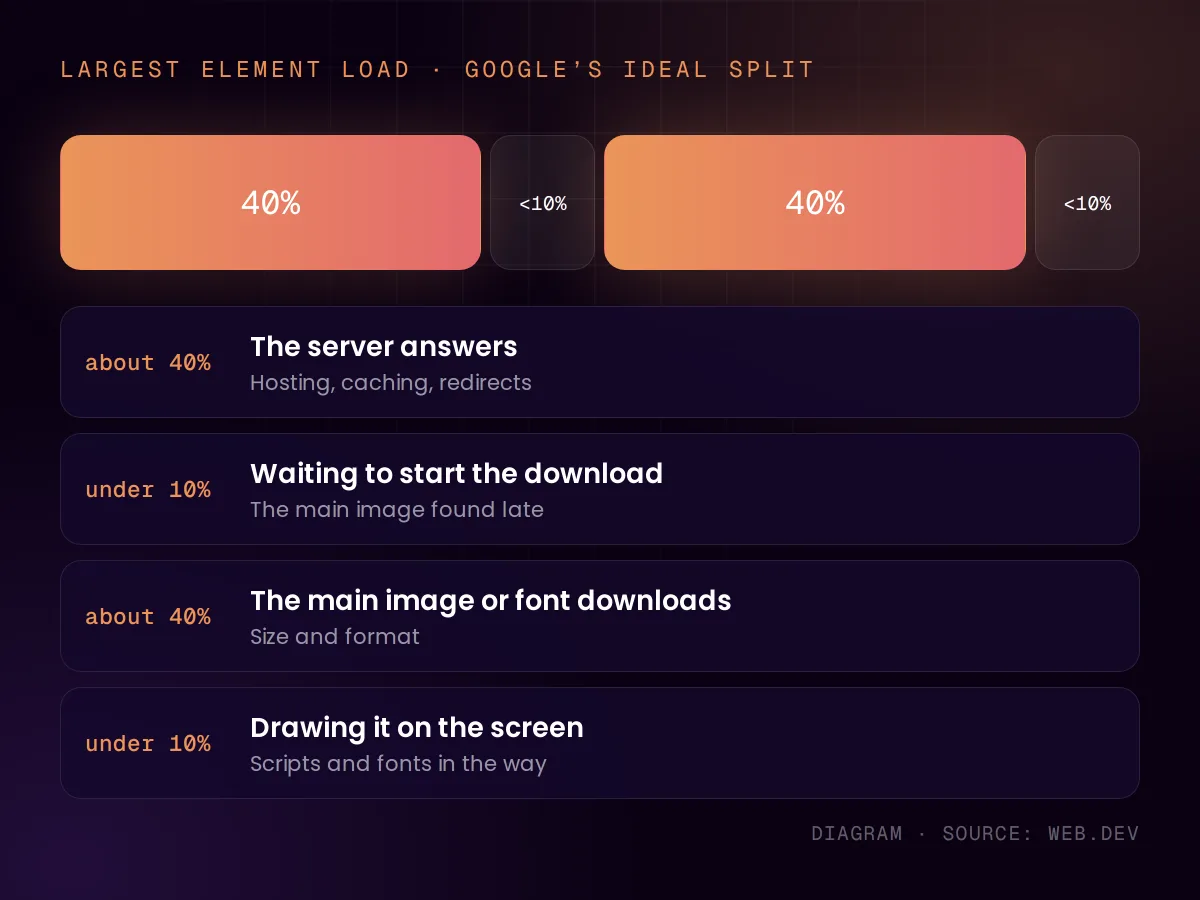
Google breaks the loading time of the largest element into four parts and gives each an ideal share: about 40% for the server to answer, about 40% for the main image or web font to download, and under 10% each for the wait before and after. A fix in the wrong part changes little.

On most pages images weigh the most, then JavaScript, then fonts. So the work is usually a faster server response and caching, a main image in the right size that starts loading at once, less JavaScript on the first screen, and space reserved for what arrives later.

  • Server response and caching
  • Images, fonts and the first screen
  • Less JavaScript where it blocks a tap

Keep

Fast today is not fast next year.

Sites slow down again. A new tag here, a larger image there: Google notes that one tag has little effect, but that the effect “can become significant when tens or hundreds of tags are used on the same page”. The median mobile home page weighed 2.56 MB in 2025.

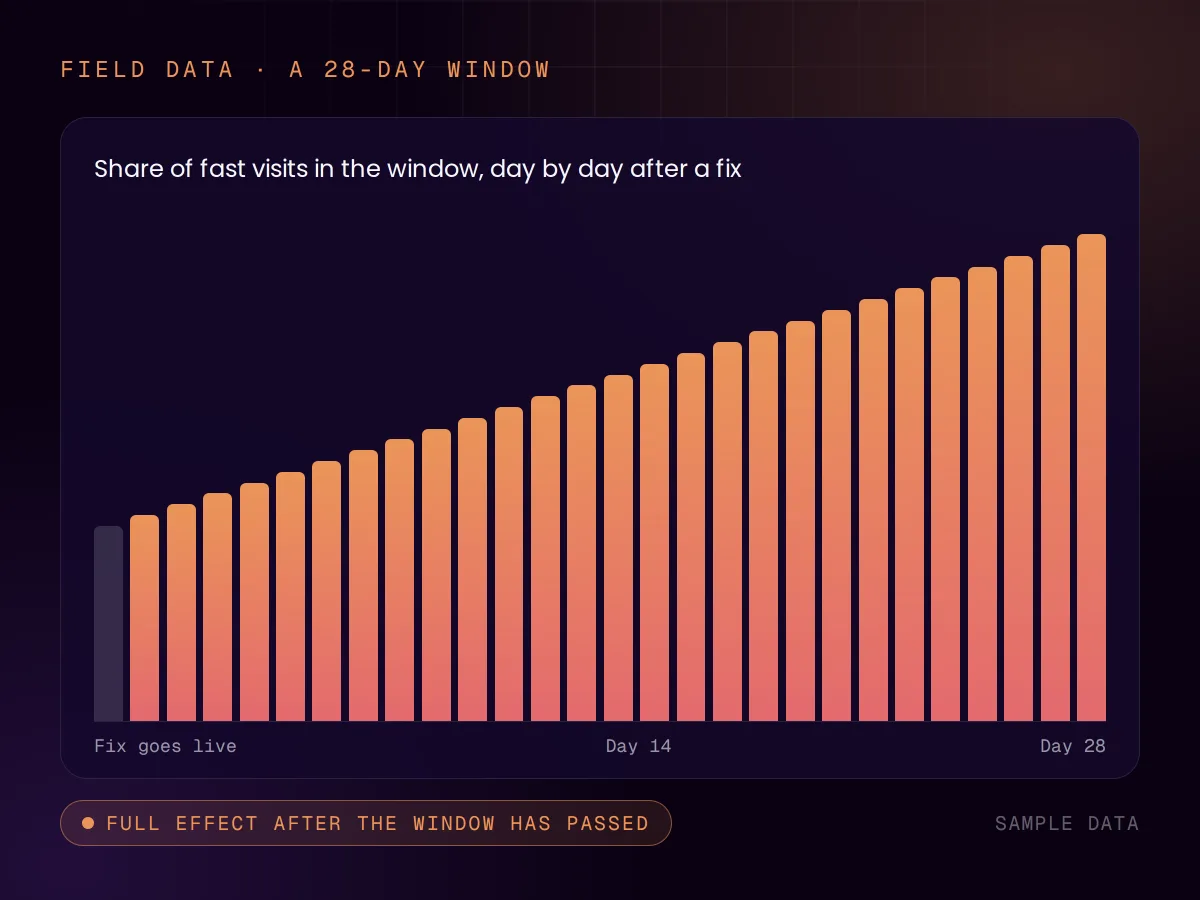
Field data also lags. Because it covers 28 days, a fix shows up in Search Console only after some weeks. We check again once the window has passed, at no extra charge, and you get a written list of what changed, why, and how to undo it.

  • A second check after the 28-day window
  • A written record of every change
  • A list of tags with an owner for each

Sources: Google, Why lab and field data can be different (opens in a new tab), Chrome for Developers, CrUX methodology (opens in a new tab), Google, Optimize Largest Contentful Paint (opens in a new tab), Google, Best practices for tags and tag managers (opens in a new tab), HTTP Archive, Web Almanac 2025: Page Weight (opens in a new tab)

Your tracking

We do not trade your data for a score.

The quickest way to a higher score is to delay or remove analytics, the tag manager and the consent banner. The test stops seeing them. So do you: visitors who leave quickly are no longer counted, and ads lose the conversions they are steered on.

Analytics stays where it is
We do not remove, delay or lazy-load your analytics, tag manager or conversion tracking to improve a score. If one of them costs speed, we tell you what it costs and leave the decision to you.
The consent banner loads first
Google’s own guidance says a tag manager is not typically the best way to load a cookie notice, because that tends to delay it. We load it directly, so consent is asked before anything depends on it.
Other scripts are fair game
Chat widgets, old pixels, unused tags, embedded video and maps can often load later or go. Google advises firing non-essential tags after the page has loaded.
The cost is written down
Where tracking keeps a score below 100, the report says so, with the number. You can then explain the score to anyone who asks.

Sources: Google, Best practices for tags and tag managers (opens in a new tab)

Tune or rebuild

When fixing is enough, and when it is not.

Some sites are slow because of how they were put together. Then tuning reaches a ceiling, and we say so in the audit before you pay for fixes.

What the audit finds
Heavy images, no caching, fonts loaded late
What usually helps
Resize and reorder, set caching
Tune or rebuild
Tune
What the audit finds
Many added scripts and tags
What usually helps
Remove the unused ones, load the rest later
Tune or rebuild
Tune
What the audit finds
A slow server or cheap hosting
What usually helps
Better hosting or a cache in front of it
Tune or rebuild
Tune, with a hosting change
What the audit finds
A page builder or theme that loads everything on every page
What usually helps
Limited gains within the builder
Tune or rebuild
Often a rebuild of the key pages
What the audit finds
Dozens of plugins or apps the business depends on
What usually helps
Replace the heaviest ones
Tune or rebuild
Depends on what can be replaced

A general guide, not a rule. The audit states which of these applies to your site.

Honest scope

No promised score.

Google writes that a perfect score of 100 is “extremely challenging to achieve and not expected”. On rankings it says there is “no single signal”, and that it shows the most relevant content even when the page experience is below par.

What we commit to

  • An audit with lab and field data, per page type.
  • Fixes listed in order of effect, with a fixed price.
  • Your tracking and consent banner left working.
  • A second measurement after the fixes.
  • A plain message when a rebuild is the cheaper answer.

What nobody can promise

  • A score of 100, or any fixed score.
  • A load time on every device and connection.
  • A higher position in Google.
  • More sales from speed alone.
  • That the site stays fast without upkeep.

Sources: Chrome for Developers, Lighthouse performance scoring (opens in a new tab), Google Search Central, Understanding page experience (opens in a new tab)

How we work

Audit, quote, fix, check.

  1. 01 · Audit

    Find the causes

    Field data where it exists, a lab test of every page type, and the list of scripts the site loads.

  2. 02 · Quote

    A price per fix

    Each fix with its expected effect and a fixed price. You choose which ones to do.

  3. 03 · Fix

    Change and test

    We make the changes, test that forms, tracking and the consent banner still work, and measure again.

  4. 04 · Check

    After 28 days

    A second look at the field data once the window has passed, and the written record of what changed.

Speed audit

From €250

Fixed and agreed before we start. Fixes are quoted after the audit, each with its own price. For UK clients we quote in pounds on request. See all pricing

FAQ

Questions about Website Performance

Reviewed by Chris de Gruijter,

Find out what slows your site down.

Start with the free AI Scan, or ask for a speed audit of your site.